

Estate Explorer
Estate Explorer is the interactive analytics hub at the heart of Dr Migrate: the place you go to make sense of everything discovery found. It delivers a live, drill-anywhere experience: start from a one-screen summary of the whole estate, then move into applications, infrastructure, technologies, modernization, network and the AI Advisor without ever leaving the page.
Estate Explorer is a great validation tool early on. Open it right after ingestion to sanity-check that discovery captured what you expected, even before you start mapping.
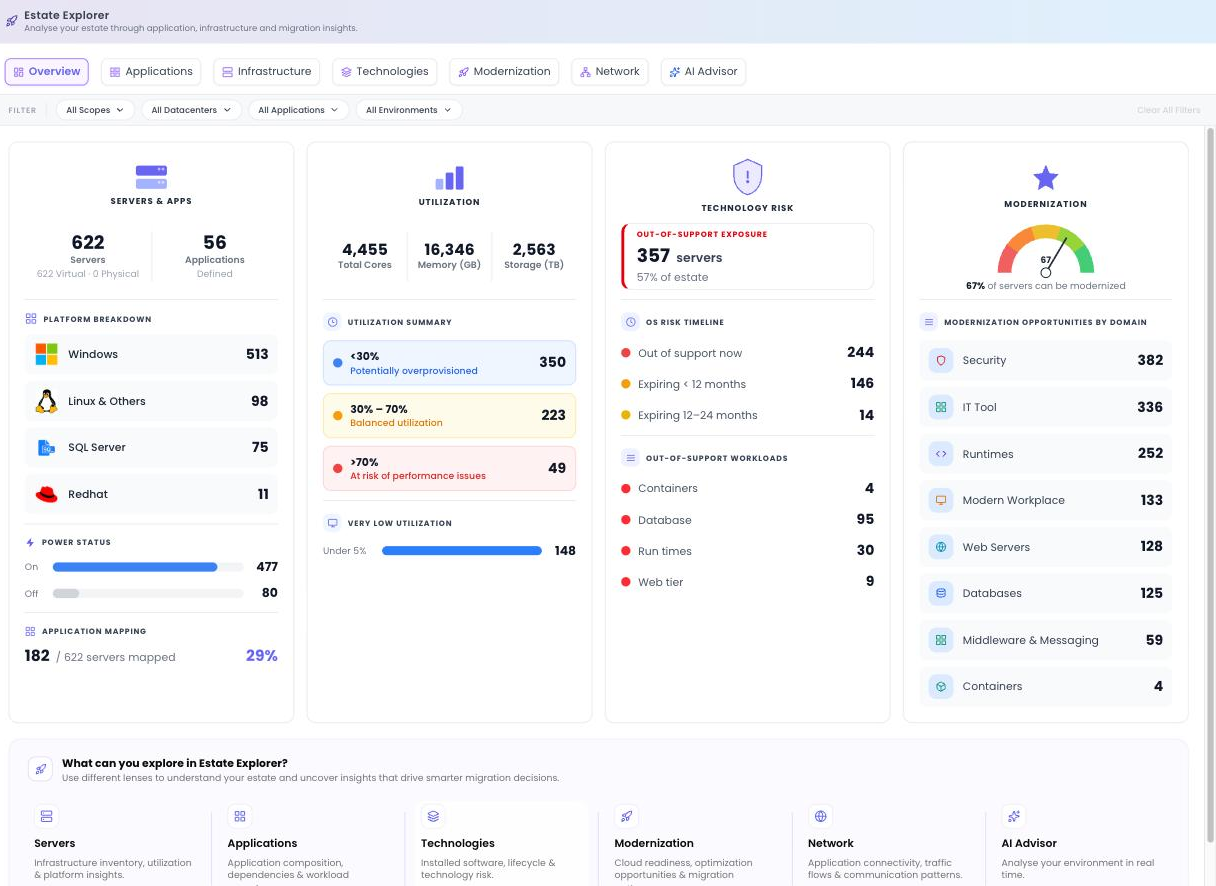
How Estate Explorer is organised
Three things stay constant wherever you are in Estate Explorer:
| Element | What it does |
|---|---|
| The filter bar | A global filter across the top: All Scopes, All Applications, All Environments and Clear All Filters. Whatever you set here narrows every tab at once, so you can isolate a scope, an environment or a single application and have the whole hub respond. |
| The tabs | Seven top tabs (Overview, Applications, Infrastructure, Technologies, Modernization, Network, and AI Advisor), each answering a different question about the estate. |
| Lenses | A recurring concept that lets you view the same data different ways: by server, by application, by technology, by treatment, or by support status. Lenses turn one dataset into several planning views without re-querying. |
Integrated Export is available across views, so any table or breakdown you are looking at can be taken out for offline analysis, sharing or reuse (for example as a starting point for firewall rules or a stakeholder pack).
Infrastructure and Technologies work straight after discovery, even without workload mapping, because they rely on Dr Migrate's signature mapping. Applications becomes richer the more you map. See why mapping first matters below.
The Overview tab
Overview is your estate at a glance. It lands on four panels, each summarising a different dimension so you can set direction in seconds and decide where to dig deeper. Counts shown in product are live for your estate; the descriptions below explain what each tile measures rather than asserting fixed numbers.
Servers & Apps
The first panel sizes the estate: total servers (split into virtual and physical) and the number of applications defined so far. Alongside it sit three breakdowns:
- Platform Breakdown: the mix of platforms across the estate, for example Windows, Linux and SQL Server.
- Power Status: how many servers are powered On versus Off, a quick pointer to decommission candidates and zombie machines.
- Application Mapping %: how much of the estate has been mapped to applications. This is the single best indicator of how planning-ready your data is.
Utilization
The second panel totals the estate's capacity: Total Cores, Memory and Storage, then characterises how well it is used:
- Utilization Summary: servers grouped as overprovisioned (under 30% utilised), balanced (30–70%) or at risk (over 70%).
- Very Low Utilization: the servers running far below their allocation, where right-sizing or consolidation will pay off fastest.
Technology Risk
The third panel is your support-exposure heat-check. It surfaces out-of-support exposure across the estate and an OS Risk Timeline that buckets operating systems by urgency: out of support now, expiring within 12 months, and 12–24 months. The Out-of-support workloads figure tells you how many workloads are already exposed, so risk reduction can be prioritised immediately.
Modernization
The fourth panel answers "how much of this can move forward, not just across?" It shows the percentage of servers that can be modernized and lists Modernization Opportunities by Domain, pointing you at the themes (security, platform services, app stacks, modern workplace) with the most to gain.
What you can explore
From Overview, move into any of the deeper tabs. Each is a full workspace in its own right:
Your application portfolio: opportunity, risk and planning lenses, and the per-app Application Drawer.
Infrastructure inventory, utilization and platform insights.
What you're running and what you can modernise: domains, app stacks, COTS and software search.
Opportunities by domain and the Cloud Readiness assessment for Servers, SQL, Java and .NET.
Connectivity, dependencies and traffic patterns, ranked by network gravity for wave planning.
Ask questions about your estate in natural language, fully aware of your planning context.
Why mapping first matters
The insights here are baseline straight after discovery and become planning-aware as you map workloads and make treatment decisions. Infrastructure and Technologies are useful immediately because they run on signature mapping. But the Applications portfolio, network gravity, wave planning and cost projections all sharpen dramatically once workloads are tied to applications, so the single most valuable next step is usually mapping.
Head to Workload Mapping to raise your Application Mapping %, the single change that improves the most insights at once.
Where to go next
What you learn here feeds your plan. When you've spotted the risks and opportunities, move to Plan → Migration Planning to turn them into treatments and waves.