

Infrastructure
The Infrastructure tab is your server-inventory and optimisation workspace. It works straight after discovery (no workload mapping required) because it runs on Dr Migrate's signature mapping. A left sub-navigation moves you between six views: Snapshot, Servers, Optimization, Storage, Hardware and AWS. Click any server in the Servers view to open its Server Drawer.
Snapshot
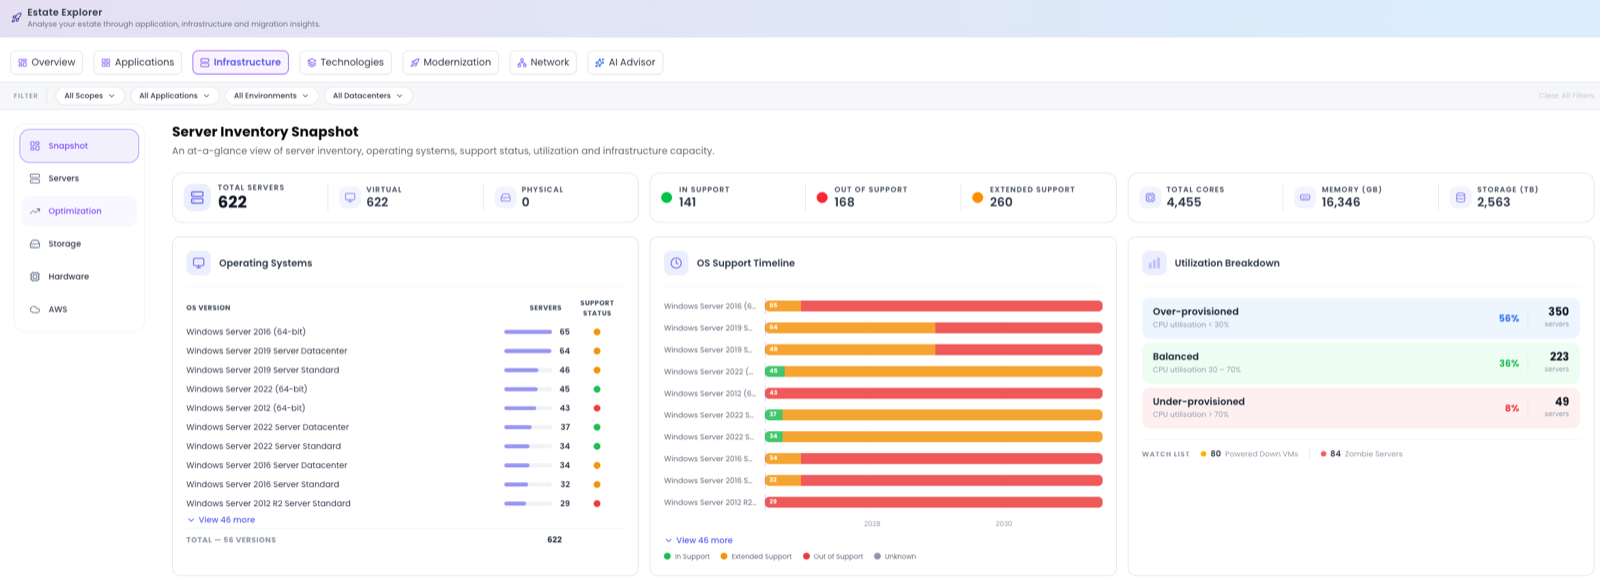
Snapshot is the infrastructure at a glance. Headline tiles cover Total Servers split into Virtual and Physical; support status as In Support, Out of Support, Extended Support and Unknown; and capacity totals for Total Cores, Memory and Storage. Below the tiles:
- Operating Systems: the OS families present across the estate.
- OS Support Timeline: when those operating systems fall out of support.
- Utilization Breakdown: servers grouped as Over-provisioned, Balanced, or Under-provisioned.
- Watch List: machines that warrant a closer look, including Powered Down VMs and Zombie Servers.
Servers
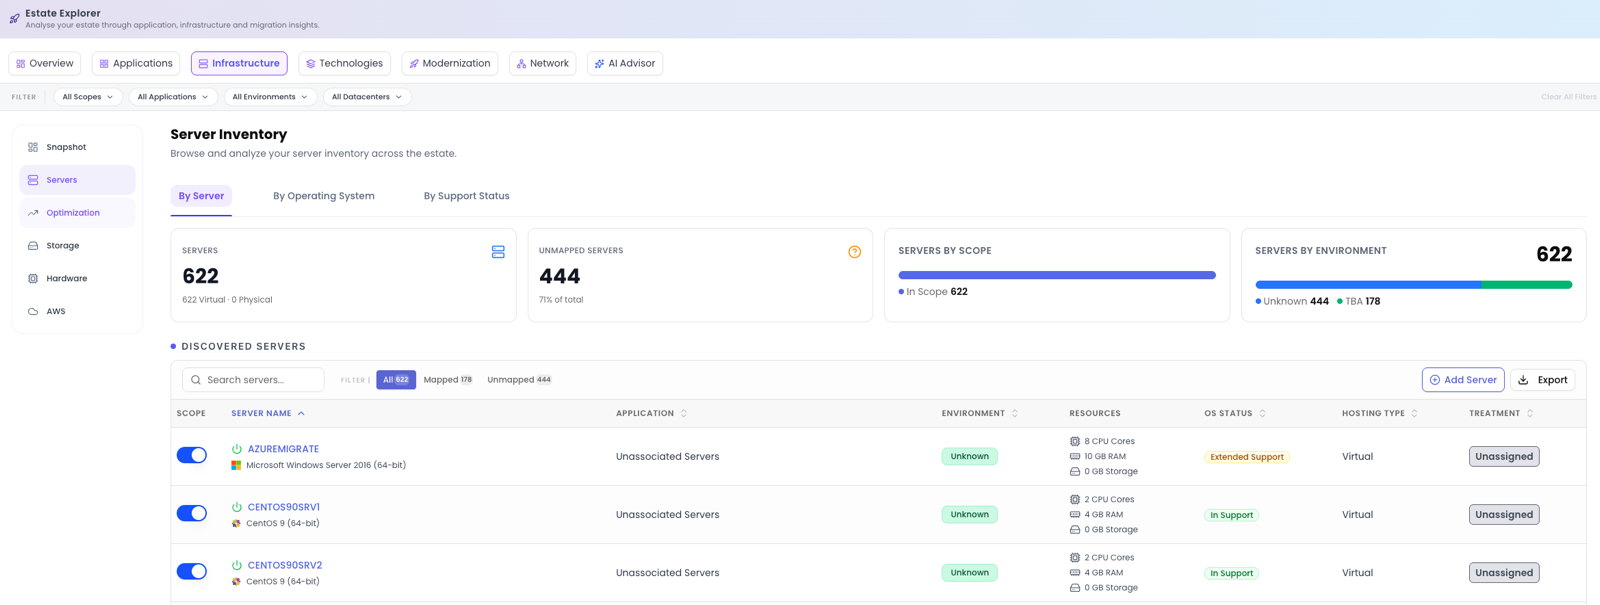
Servers is the full discovered inventory. Three tabs reframe the list (By Server, By Operating System, and By Support Status) and tiles summarise Servers, Unmapped, In Scope and a breakdown By Environment. The Discovered Servers table carries these columns:
| Column | What it shows |
|---|---|
| Scope toggle | Bring a server in or out of scope. |
| Server Name | Click to open the Server Drawer. |
| Application | The application it's mapped to, if any. |
| Environment | Where it runs. |
| Resources | Cores, memory and storage. |
| OS Status | In, out of, or extended support. |
| Hosting Type | Virtual or physical. |
| Treatment | The current 6R treatment. |
Add Server lets you define a machine manually, and Export takes the list out. Clicking a server name opens the Server Drawer.
Optimization
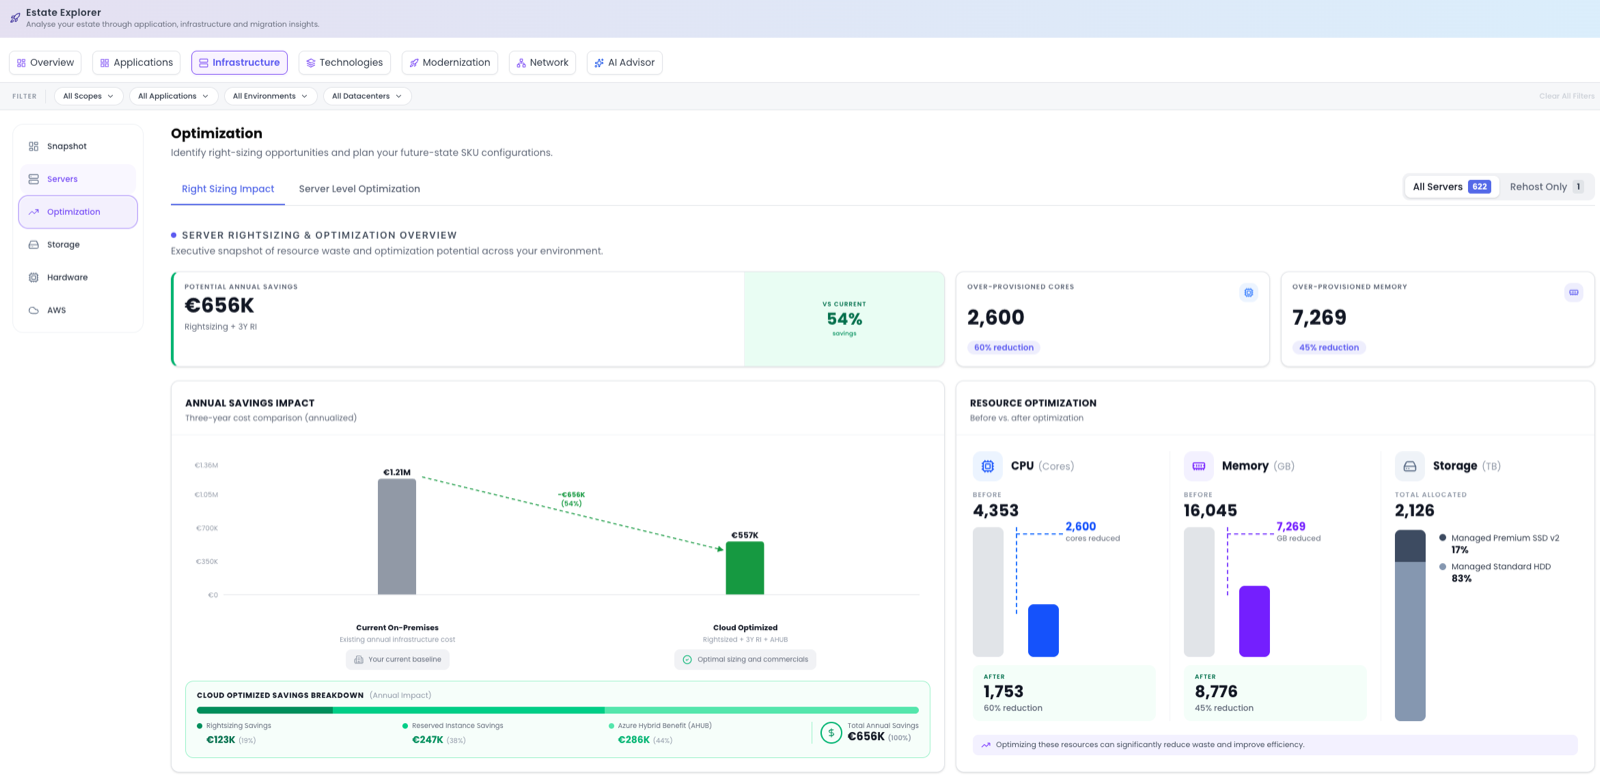
Optimization is the core of the Azure cost story. Two tabs (Right Sizing Impact and Server Level Optimisation) and a scope toggle between All Servers and Rehost Only let you focus on where right-sizing is actually the lever. The headline Potential Annual Savings compares your right-sized Azure cost, with 3-Year RI (Reserved Instances) and Azure Hybrid Benefit applied, against taking the on-premises footprint as-is. It quantifies over-provisioned cores and memory, shows before/after for CPU, Memory and Storage, and breaks the saving down by source: Rightsizing, Reserved Instance and Azure Hybrid Benefit.
As you assign more 6R treatments, the Rehost Only scope isolates the workloads where right-sizing genuinely applies, sharpening the savings number.
Storage
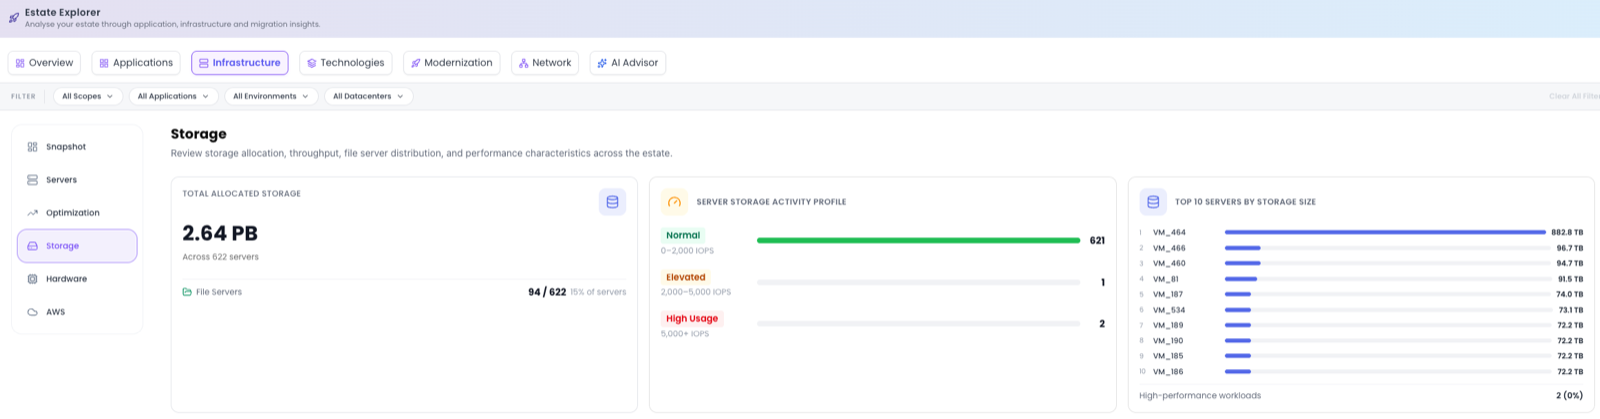
Storage profiles where data lives and how hard it works. It shows Total Allocated Storage and the number of File Servers, then a Server Storage Activity Profile that classifies servers by IOPS as Normal, Elevated or High Usage. The top servers by storage and a full Storage Inventory table let you find hot-spots and plan disk tiers.
VMware
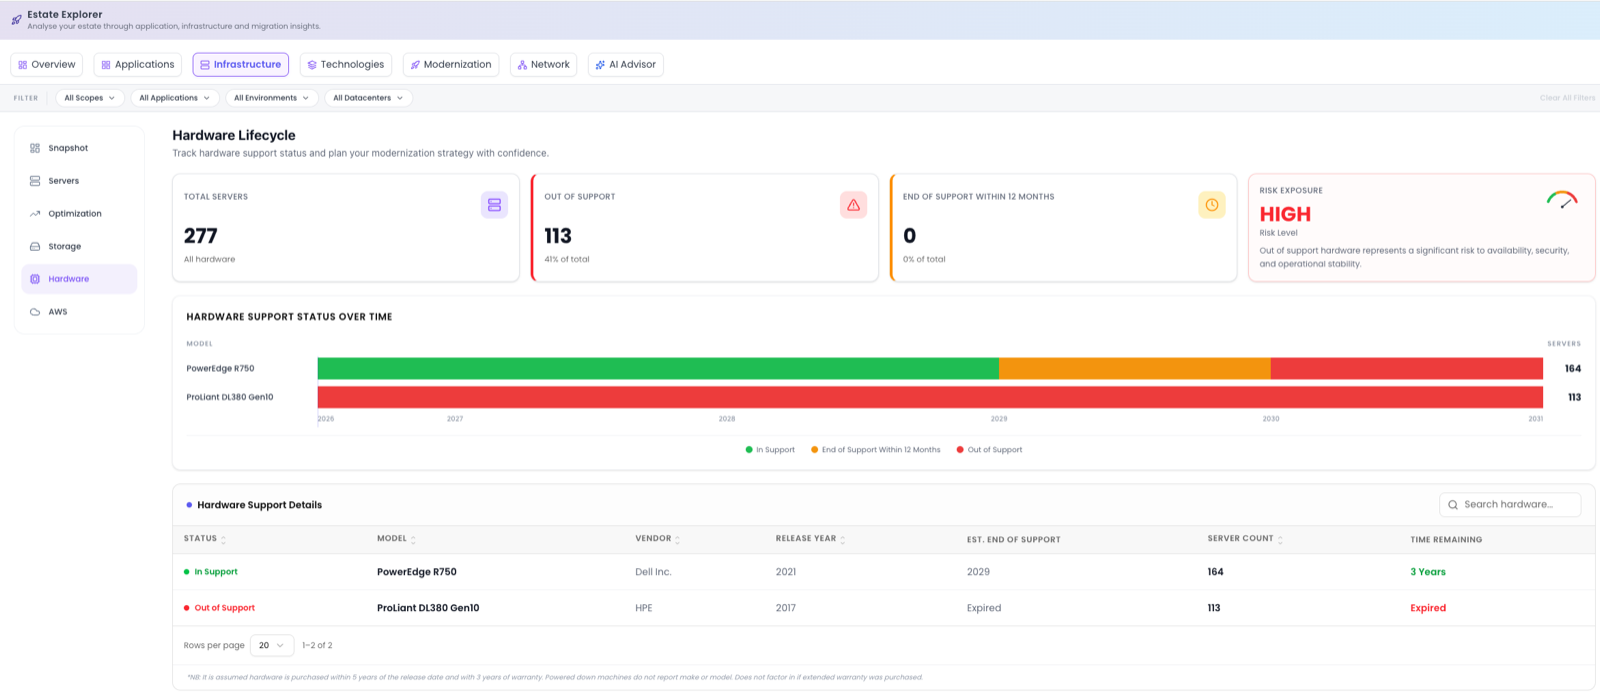
The VMware sub-section checks the VMware hosting layer against support baselines, providing useful evidence for a refresh-or-migrate case. The Hardware Lifecycle tiles cover Total Servers, Out of Support, End of Support within 12 months and overall Risk Exposure. A Hardware Support Status Over Time chart shows how exposure evolves, and the Hardware Support Details table lists Status, Model, Vendor, Release Year, Est. End of Support, Server Count, Host Count and Time Remaining.
Hardware support dates are estimated from model and release year against typical support baselines; the exact warranty start is not always known. Treat these as indicative rather than contractual.
AWS
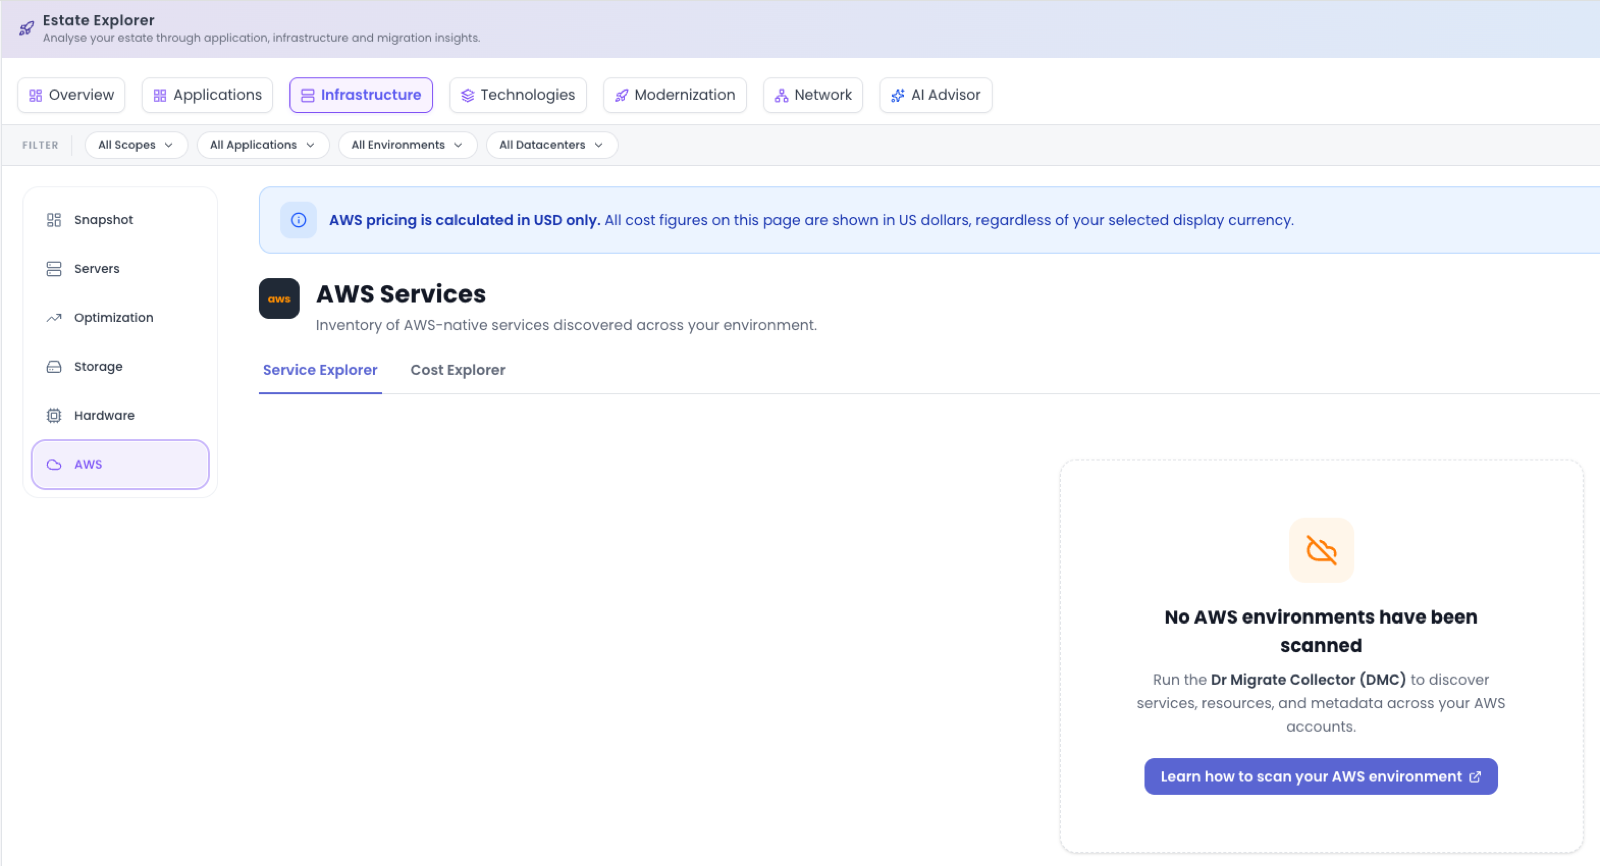
Where DMC discovered an AWS estate, the AWS Services view lights up. Every EC2 instance appears as a server you can open like any other. Two tabs organise the rest: Service Explorer gives EC2 breakdowns by category, and Cost Explorer shows AWS cost by service, region and account. The view stays empty until a DMC AWS scan is run.
AWS pricing is shown in USD only. The AWS detailed views are on the roadmap and being extended in upcoming releases.
The Server Drawer
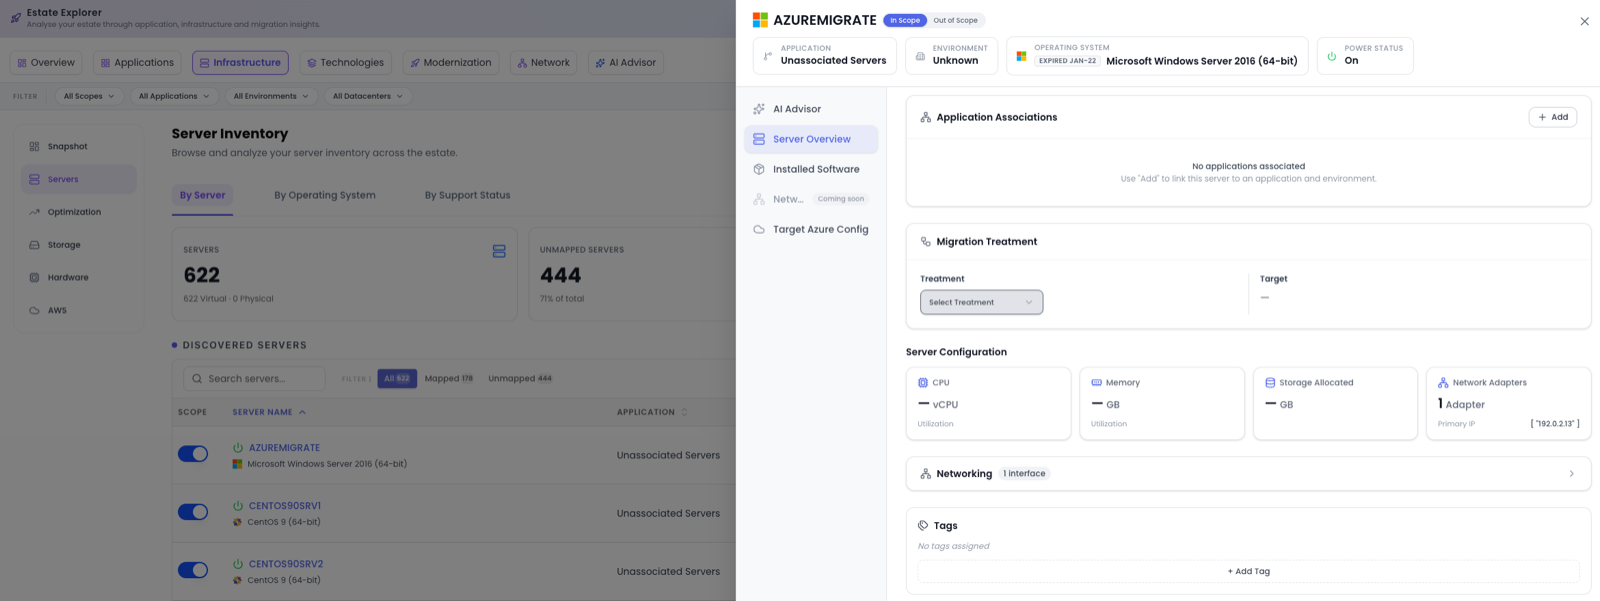
Open a server from the Servers view and the Server Drawer gives you everything about that one machine. A set of left tabs (AI Advisor, Server Overview, Tech Specification, Software, Networking, and Target Azure Config) covers configuration, software and target sizing.
Server Overview
An In Scope / Out of Scope toggle, Server Information (Power Status, OS, OS Support Status, Description), Associated Applications (with Add to map it), Migration Planning (a 6R Treatment dropdown) and Tags.
Tech Specification
Compute & OS: OS, CPU Cores, Core Utilization, Memory and Memory Usage; and Storage & Disk: Total Disks, Total Storage and Total IOPS.
Software
A Detected Software table listing Software, Version and Provider, with search to find a package quickly.
Networking
The server's network adapters (Name, Adapter Type, IP, MAC) plus Network In and Network Out traffic.
Target Azure Config
Where you shape the Azure target. It sets the Target Azure SKU, Cores and Memory; Payment & Licensing Preferences (Payment Model (for example 3 Year Reserved Instance), Region, an Apply Dev/Test Pricing toggle and a Hybrid Benefit toggle); and Azure Features to Enable (Disaster Recovery, Backup and Defender for Cloud toggles), with an Estimated Price.
Changing the Target Azure Config updates cost projections across the server, its application and the estate-wide optimisation numbers.
Where to go next
To see what those servers are running, head to Technologies; to assess Azure suitability, see Modernization.