

Application Portfolio
The Applications tab is your application portfolio: every application Dr Migrate knows about, scored for opportunity and risk, and ready to plan. This is the tab that gets richer the more you map: the more servers are tied to applications, the sharper the dependencies, costs and treatments become. Choose a lens to focus the portfolio on the question in front of you, then open any application to enter its dedicated Application Drawer.
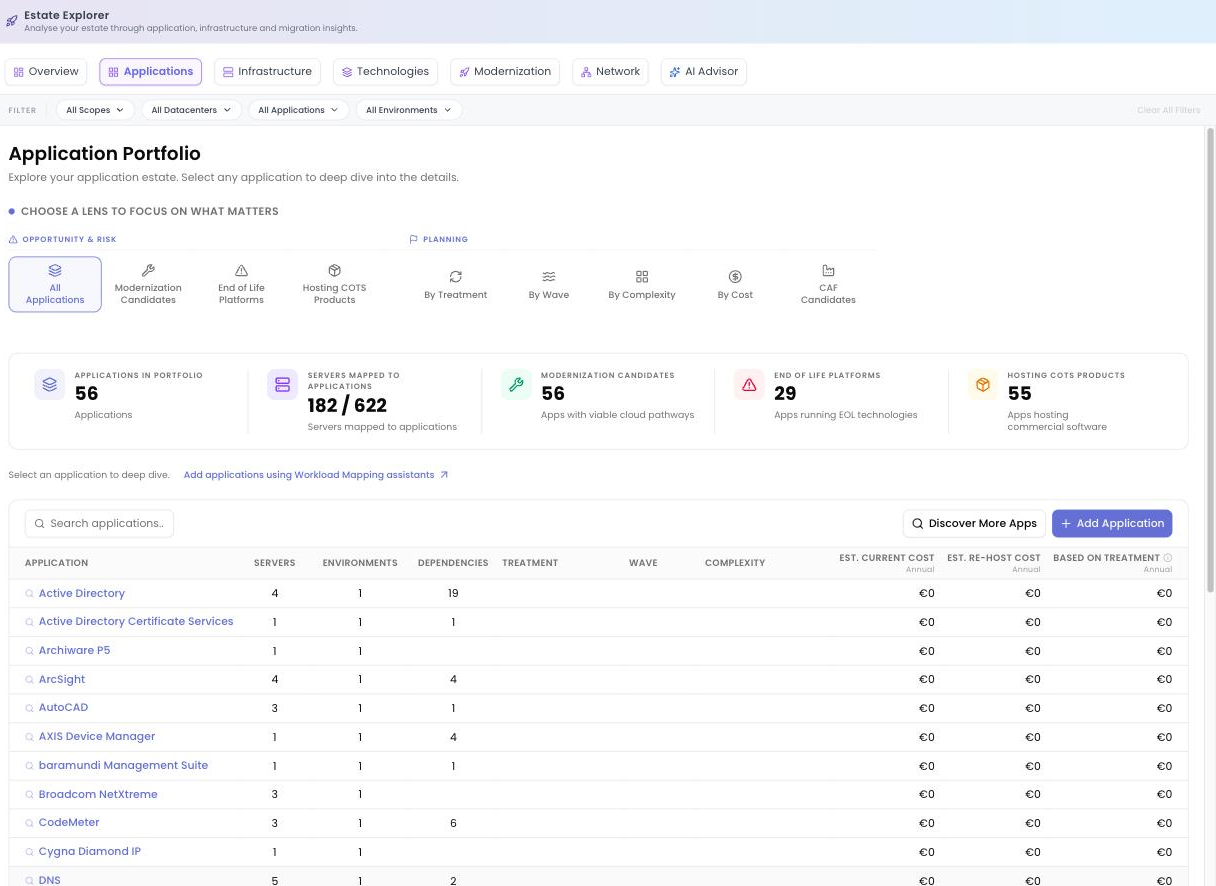
Lenses
Lenses re-frame the same portfolio for a particular job. They fall into two groups:
Opportunity & Risk
- All Applications: the complete portfolio, nothing filtered out.
- Modernization Candidates: applications with the most ways forward into Azure PaaS or managed services.
- End of Life Platforms: applications running on out-of-support operating systems or platforms, your highest-urgency risk.
- Hosting COTS Products: applications built around commercial off-the-shelf products, where the migration motion is often "follow the vendor's supported path".
Planning
- By Treatment: grouped by 6R treatment, so you can see what's decided and what's still untreated.
- By Wave: grouped by migration wave for sequencing.
- By Complexity: grouped by sizing so you can balance a wave's effort.
- By Cost: grouped by estimated cost to spotlight the biggest spend.
- CAF Candidates: applications well suited to the Cloud Adoption Framework motions.
Summary tiles
Above the table, a row of tiles sizes the portfolio at a glance: Applications in Portfolio, Servers mapped, Modernization Candidates, End of Life Platforms and Hosting COTS Products. The tiles reflect whatever filter and lens are active, so they always describe the slice you're looking at.
The portfolio table
The main table lists applications with the columns you need to triage and plan:
| Column | What it tells you |
|---|---|
| Application | The application name: click to open its Application Drawer. |
| Servers | How many servers are mapped to it. |
| Environments | The environments it spans (production, test, and so on). |
| Dependencies | How connected it is to the rest of the estate. |
| Treatment | Its current 6R treatment, if assigned. |
| Wave | The migration wave it belongs to. |
| Complexity | Its assessed size and difficulty. |
| Est. Current Cost | Estimated cost of running it as-is today. |
| Est. Re-Host Cost | Estimated cost after a like-for-like move to Azure. |
| Based on Treatment | The cost aligned to its chosen treatment, once one is set. |
Three buttons sit with the table: Discover More Apps (surface auto-detect candidates Dr Migrate has inferred from the estate), Add Application (define one yourself) and Export (take the current view out via Integrated Export).
How modernization potential is ranked
An application's modernization potential is driven by opportunity: the number of viable modernization pathways its technologies offer (the more routes into PaaS, managed services or containers, the higher the opportunity), balanced against end-of-life risk, where out-of-support platforms raise the urgency to act. Together these let the portfolio surface the applications where modernising delivers the most value soonest.
The Application Drawer
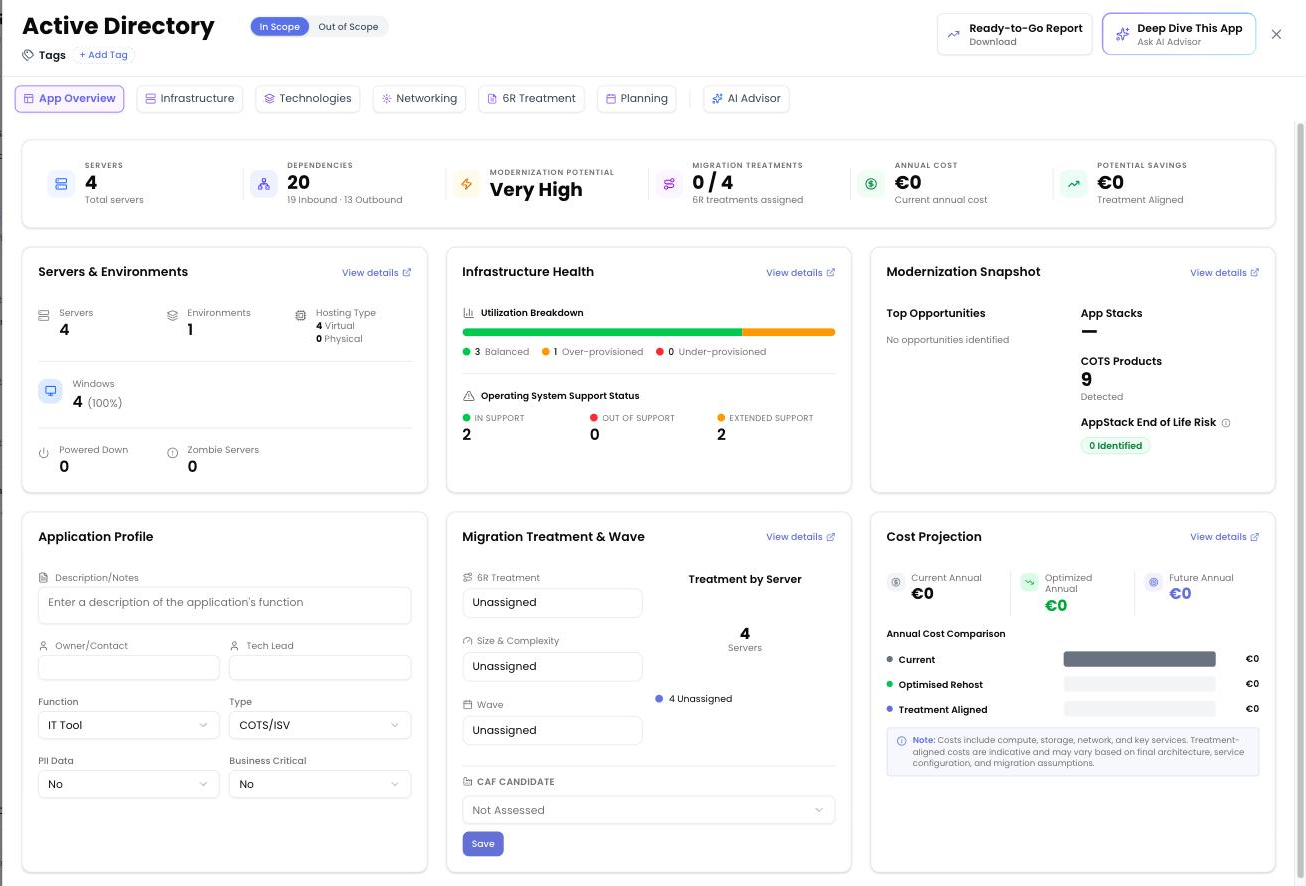
Click any application and the Application Drawer opens: the per-app "cockpit" that pulls every Estate Explorer lens into one app-scoped view. Its header carries an In Scope / Out of Scope toggle, Tags, a Ready-to-Go Report button (download an app deep-dive report) and a Deep Dive This App button (open the AI Advisor already aware of this app). Inside, the drawer is organised into tabs.
App Overview
The landing tab summarises the application end to end. Summary stats cover servers, inbound and outbound dependencies, modernization potential, migration treatments assigned (x of y), annual cost and potential savings. Below that:
- Servers & Environments: the machines that make up the app and where they live.
- Infrastructure Health: support status and utilisation at a glance.
- Modernization Snapshot: the headline opportunity for this app.
- Application Profile: editable business context: Description, Owner/Contact, Tech Lead, Function, Type, PII Data, Business Critical.
- Migration Treatment & Wave: the 6R Treatment, Size & Complexity, Wave and whether it's a CAF Candidate.
- Cost Projection: current, optimised and treatment-aligned cost so you can see the financial impact of decisions.
Infrastructure
A curated, app-scoped version of the full Infrastructure tab: Snapshot, Servers, Add Servers, Optimization and Storage, all filtered to just this application's machines, so you see its inventory, right-sizing impact and storage profile without the rest of the estate in the way.
Technologies
The Technologies lenses, curated for this app: Domains, App Stacks, Platform & Services, Security, Modern Workplace, COTS and Software Search. Use it to see exactly what the application runs and which of those technologies have modernisation pathways.
Networking
This is where the application's connectivity comes to life. It shows Connected Applications and the inbound, outbound and cross-wave dependencies, organised across tabs: App Dependencies, Application Flows, Internal Flows, All Connections and Insights. An interactive dependency graph visualises the relationships, with a legend distinguishing Same Wave, Cross-Wave and Unknown connections, and Unidirectional versus Bidirectional flows. Dr Migrate applies an intelligent roll-up (hundreds of underlying server-to-server flows summarised at the application level) and dynamic filtering so you can drill down without being overwhelmed.
6R Treatment
Plan how the app moves. Treatment Coverage shows how much of the app is decided; the Modernization Snapshot highlights end-of-life exposure, Cloud Readiness and Replace Potential. The Server Treatment Assignment table lets you set, per server, a Treatment (via dropdown) and a Target. Speed it up with Bulk Assign, Auto-Assign (let Dr Migrate recommend) or Reset.
Planning
The Planning tab frames effort and sequencing. Application Complexity & Size classifies the app as Small, Medium, Large or Extra Large, with an Estimated Duration and the Assigned Wave. It lists the Complexity Drivers behind the score: Servers, Environments, Technologies, Network Dependencies, End of Life, Business Critical and PII, and gives Wave Context so you understand why it sits where it does.
AI Advisor
Open the AI Advisor already aware of the current application. Ask about "this app" in plain language (its risks, dependencies, costs, or recommended treatments) without re-specifying which one you mean.
The App Deep Dive report (via Ready-to-Go Report) snapshots everything in the drawer (overview, infrastructure, technologies, network and treatment) into a single shareable document for you and the customer.
Where to go next
To plan dependencies across the whole estate, see the Network tab. To turn treatments and waves into a delivery plan, move to Plan → Migration Planning.