

Your Dashboard
The dashboard is your home base. It opens every time you sign in and answers one question: "Where would you like to focus today?" From here you can jump into any phase of the journey, see your progress at a glance, and reach your reports and data sources.
Everything on the dashboard is a shortcut into a deeper screen. You never have to start here, but it's the fastest way to pick up where you left off.
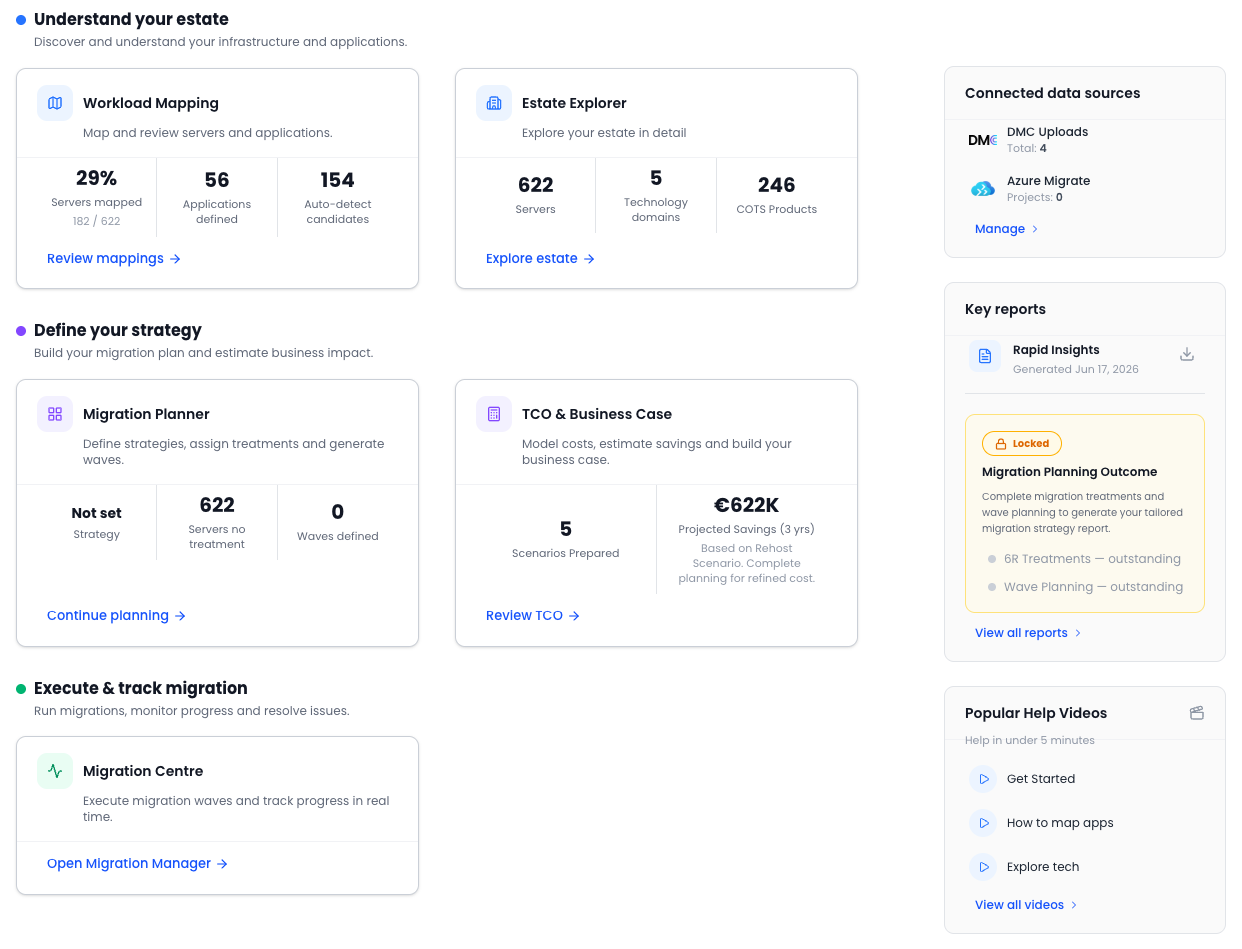
Journey cards
The centre of the dashboard presents cards for each phase: two cards each for "Understand your estate" and "Define your strategy", and one for "Execute & track migration", each showing live progress and its own next action.
| Card | What it shows | Action |
|---|---|---|
| Understand your estate: Workload Mapping | Mapping coverage, applications defined, auto-detect candidates | Review mappings |
| Understand your estate: Estate Explorer | Servers, technology domains, COTS products | Explore estate |
| Define your strategy: Migration Planner | Strategy, servers without treatment, waves defined | Continue planning |
| Define your strategy: TCO & Business Case | Scenarios prepared, potential annual savings | Review TCO |
| Execute & track migration | Entry to the Migration Centre | Migrate |
Each card links straight to the matching left-hand navigation section, so the dashboard and the menu always stay in sync.
Rapid Insights report
Once you have enough discovered data, you can generate a Rapid Insights report: an executive-level summary of your environment. Press Generate on the Rapid Insights card (Dashboard or Outputs → Executive Reports) to create it; it does not appear automatically.
It highlights the technologies discovered, potential migration opportunities, and high-level financial scenarios. Use it as your starting point for deeper exploration and to set context for stakeholders.
You can download Rapid Insights straight from the dashboard. See Outputs → Executive Reports for the full list of reports.
Connected data sources
A panel summarises your connected sources: DMC uploads and Azure Migrate projects, with a count of each and a quick link to manage them. If a source needs attention (for example a failed upload), it's flagged here. Manage them in Discover → Data Sources.
Key reports
This section lists your available and locked reports. A locked report tells you exactly what's needed to unlock it; for example, the Migration Planning Outcome report unlocks once 6R treatments and wave planning are complete.
AI Advisor
If enabled during setup, the AI Advisor lets you ask questions in natural language and get contextual help without leaving the product. It's optional and runs in an isolated environment. See Analyze → AI Advisor for how it works and how it differs from the AI used inside the product's analysis.
Help videos
A Popular Help Videos section offers short (under five minutes) onboarding clips covering getting started, mapping applications, and exploring your technology estate.
What to do next
New here?
Generate your Rapid Insights report to understand what was discovered.
Ready to go deeper?
Head to Workload Mapping: mapping is the single most valuable step for accurate insights and planning.