

TCO Analysis
TCO Analysis gives you a live, interactive view of current versus future cost, driven by your actual migration plan. Because costing was overhauled for accuracy and richer visuals, the figures update in-product as your treatments and waves change, and reflect your estate rather than generic assumptions.
A currency and region context, a 1 Yr / 3 Yr / 5 Yr horizon toggle and a filter bar apply across the screen, so every view reflects the same assumptions.
How the screen is organised
TCO Analysis has four top tabs. Use them to move from the forward-looking plan, to today's baseline, to side-by-side scenarios, to the assumptions behind it all.
Future Costs
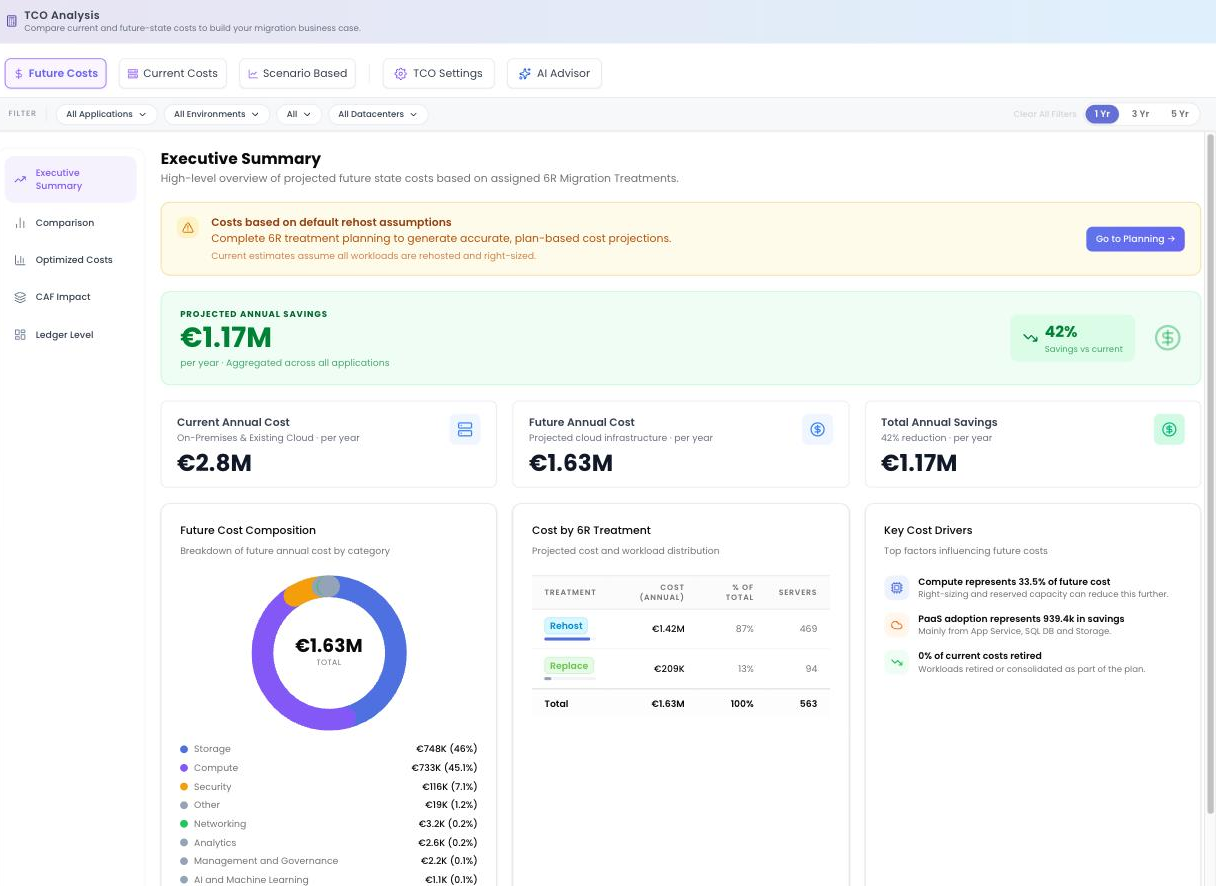
Future Costs project your cloud spend from the plan. A left sub-nav moves from headline to detail: Executive Summary, Comparison, Optimized Costs and Ledger Level.
Future cost basis: if you have not yet done 6R treatment planning, future costs are based on re-host assumptions. Once treatments are assigned, the figures reflect your actual treatments.
Executive Summary
The one-screen headline: Projected Annual Savings, Current vs Future Annual Cost and Total Annual Savings. Below that, Future Cost Composition breaks projected spend into five categories: Storage to IaaS, Backup & DR, Compute to IaaS, Licensing, and Security, Monitoring & Governance; Cost by 6R Treatment shows where the money goes by treatment; and Key Cost Drivers calls out what's pushing the number.
Comparison
Sets future against current and shows the cost change by category as a delta. A Server Workload Shift view shows how servers move to Azure VMs, PaaS Services and other Azure Services.
Optimized Costs
Optimized Costs breaks down where Azure savings come from, with separate views for Servers and SQL.
The Servers view shows a Rehost Financial Impact panel with the total optimisation impact, then two breakdown sections:
- Compute Optimization: line-item savings from right-sizing and compute efficiency.
- Licensing & Commercial Opportunity: savings from Hybrid Licensing and Reserved Instance Optimization.
The SQL view shows Actual Migration Outcomes with per-destination cards for each SQL migration path: Rehosted on Azure VMs (IaaS), Azure SQL Managed Instance and Azure SQL Database. Each card shows Servers, SQL Cores, Annual Cost, Savings vs Current, Licensing Model, Consolidation and Operational Efficiency.
Ledger Level
Ledger Level is a full itemised cost ledger with four view tabs:
| View | Columns |
|---|---|
| By Category | Workload Category, Current Workload, Future Workload, Server Count, Compute / Storage / Licensing / Networking Cost, Total Cost, Comments. |
| Resource View | Line Item Name, Application, Datacentre, Current Cost, Future Cost, Projected Annual Savings. |
| App View | Application, Migration Strategy, Datacentre, Servers, Current Cost, Future Cost, Savings, Savings %. |
| By 6R Treatment | Treatment, Workloads, % of Total, Compute / Storage / Licensing / Network Cost, Total Cost, Cost per Workload. |
Summary chips at the top show Applications with Workloads, Servers and Storage. Export and search controls are available across all views.
Current Costs
Current Costs establish today's baseline from your benchmark assumptions. A left sub-nav offers Overview, Breakdown and Adjust Benchmark.
The Estimated Current Annual Cost comes from the benchmark baseline. Cost Composition breaks it across ten categories (exact proportions vary by estate): Storage, Virtualisation, Hardware, Backup, Windows License, Networking, Monitoring, Endpoint Protection, Electricity and Data Center; and Key Cost Drivers highlights the largest contributors, typically virtual server and infrastructure costs, data centre facilities, storage capacity and licensing.
Use Adjust Benchmark to tune the baseline current-cost assumptions when you know the customer's real data centre costs; accurate baselines make the savings story credible.
Breakdown
Breakdown slices the current cost baseline by grouping, so you can see which parts of the estate are driving spend. Three grouping tabs let you view costs by Environment, Datacenter or Application. Each view shows a stacked cost bar chart alongside a Cost Breakdown by Server table with columns: Server Name, Application, Environment, Datacenter, Scope and Estimated Cost Annual. An Export control is available in all groupings.
Scenario Based
Scenario Based lets you build and compare Common Scenarios side by side, live in the platform. A left sub-nav covers Rehost All, Partial Modernization, VMware on Cloud, SKU Comparison and SQL Modernization.
Side-by-side scenario cards, for example Rehost All, Modernization and Azure VMware, showing each option's annual savings, implementation complexity and key benefits, backed by a Cost Breakdown by Migration Scenario table.
Scenario analysis is now live in the platform, previously only available in the Rapid Insights report.
TCO Settings
The fourth top tab, TCO Settings, holds the cost assumptions that drive every future-state figure: region pricing, reserved-instance discounts, hybrid benefit and the on-premises benchmark. Default pricing rarely matches real agreements, so getting these right is what makes the numbers trustworthy.